Case study · Self-initiated concept, 2026
Where has the forest died?
A monitoring tool that answers it, and two harder questions: since when, and how sure can we be. Built on nine summers of real satellite data from the upper Harz.
Problem
Large parts of the old spruce in the upper Harz have died since the 2018 drought. Seeing that is easy. Saying exactly where, since when and how sure you are usually takes GIS software and someone who knows how to drive it.
Outcome
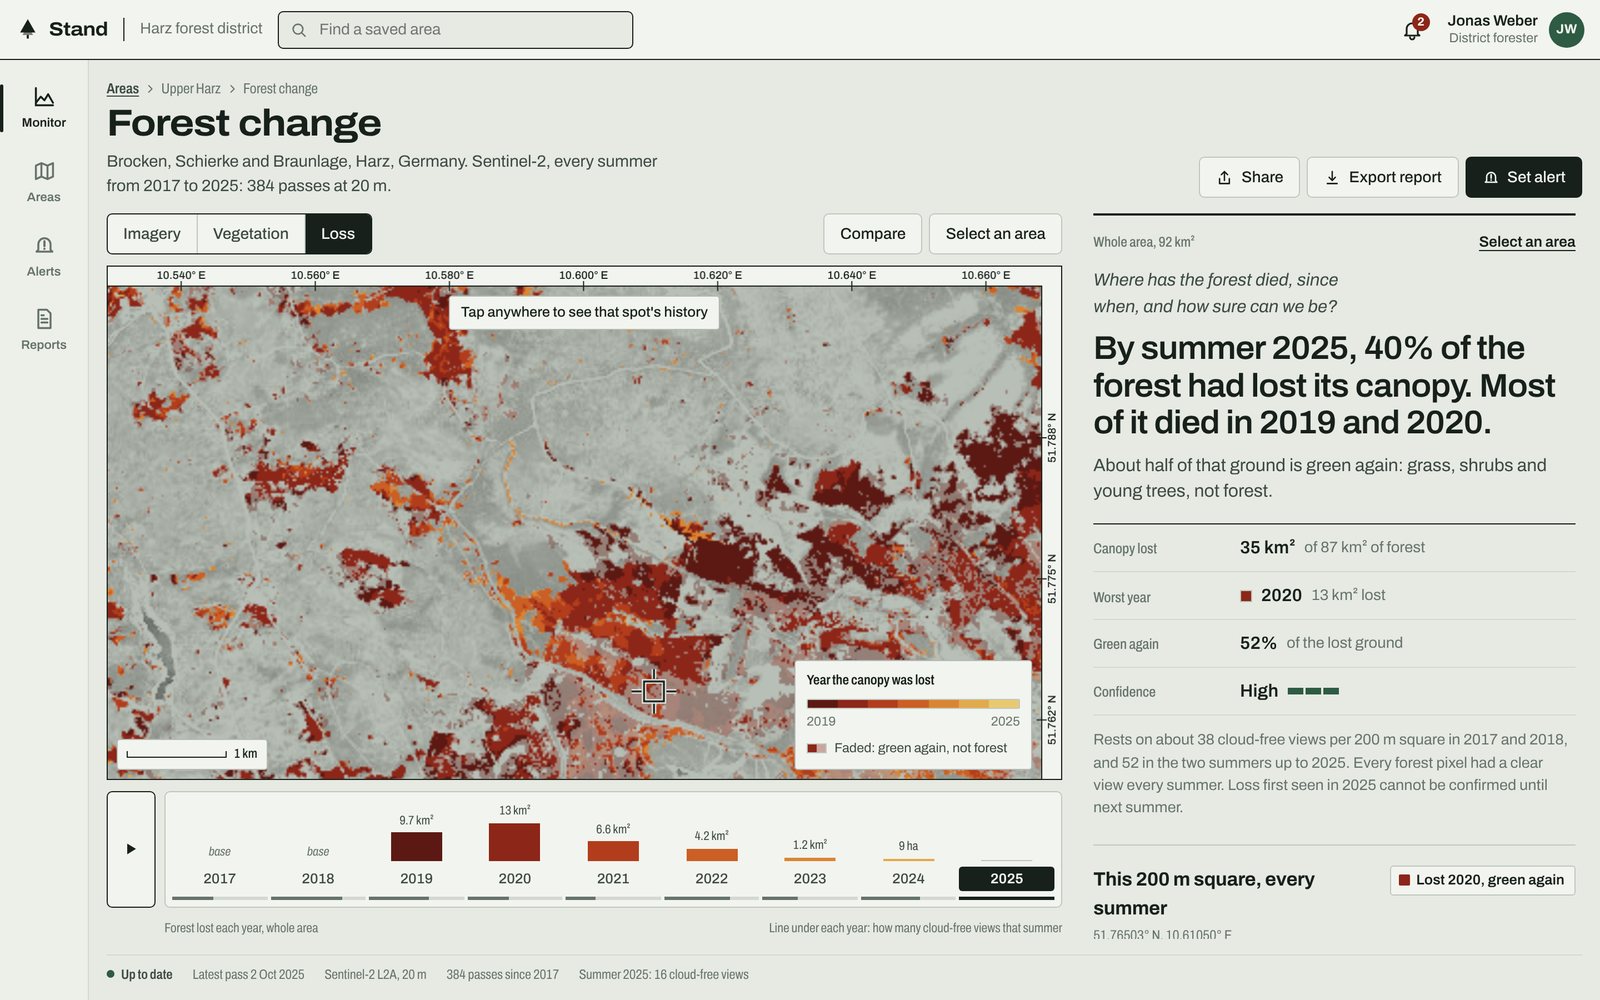
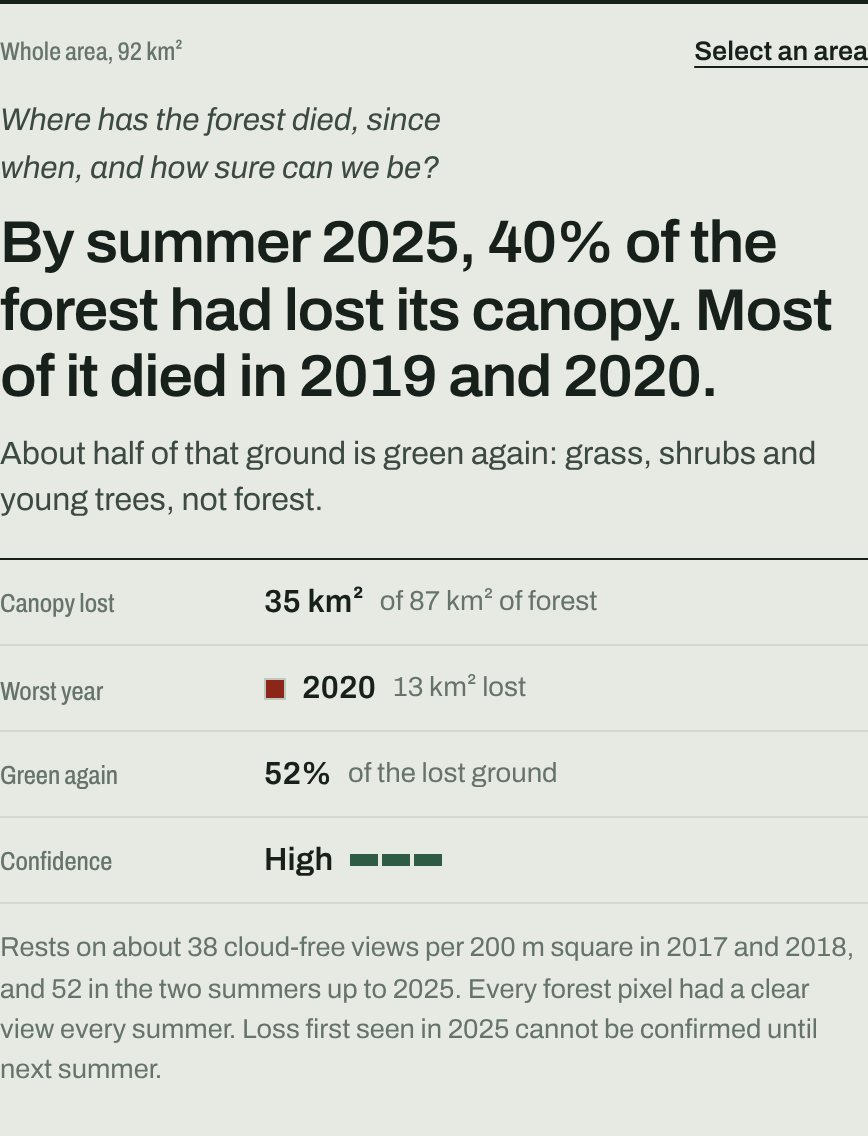
A working prototype that answers on one screen, on desktop and phone: about 40% of the forest lost its canopy, most of it in 2019 and 2020. Half of that ground is green again, and it isn't forest.
- Role
- Everything: framing the question, interaction and visual design, the data pipeline and the front end
- Data
- Copernicus Sentinel-2, 384 passes, April to October, 2017 to 2025, at 20 m
- Designed for
- A district forester, a state analyst and a commercial buyer
Prototype: forest.tylerhagan.co.uk · Civic: forest.tylerhagan.co.uk/?theme=civic · Orbital: forest.tylerhagan.co.uk/?theme=orbital
Why this problem
I wanted a brief that exercised the whole job: layered map data, change over time, and charts that turn data into a decision.
The Harz dieback is one of the clearest change stories in Europe. After the 2018 drought, bark beetle took large parts of the old spruce around the Brocken within a few years, and freely available Sentinel-2 imagery covers all of it, summer after summer. It is real, it is visible, and it is genuinely hard to measure well.
One question, three parts
Before touching the data I wrote down the question a forester or an analyst actually asks: where has the forest died, since when, and how sure can we be? Each part became a part of the interface.
Where is the map. Since when is the timeline, which doubles as the loss chart, so picking a year and reading the trend are the same gesture. How sure is a confidence rating that explains itself rather than just scoring itself.

The data
A 9.6 km square around the Brocken and Schierke at 20 m resolution: 384 Sentinel-2 passes from April to October, 2017 to 2025. Cloud, shadow and snow are masked and left as gaps, never filled in. Each summer becomes the median of its clear views, and 2017 and 2018 form the baseline everything else is measured against.
A small Python pipeline finds the scenes through a STAC catalogue and reads only the window it needs from cloud-optimised GeoTIFFs, the open standards most imagery platforms now share. Everything else runs in the browser, drawn directly to canvas and SVG, with no map library in between.
Five decisions that shaped it
Answer first, evidence second
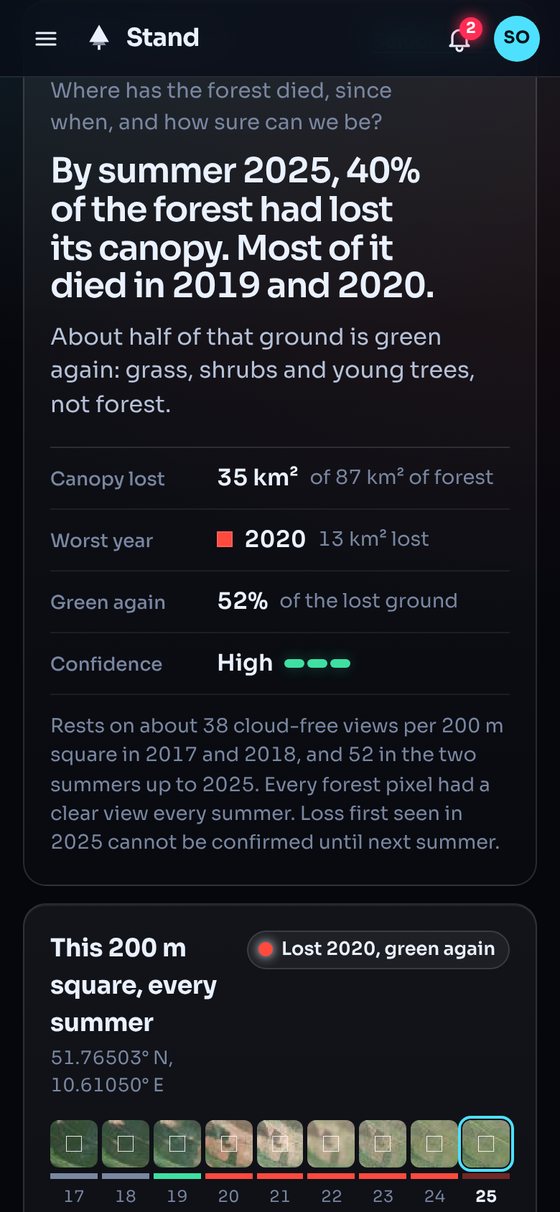
Most remote sensing tools open on imagery and leave the conclusion to you. This one opens on a sentence: by summer 2025, 40% of the forest had lost its canopy, most of it in 2019 and 2020. The map, timeline and charts sit underneath as evidence you can interrogate. Draw a box anywhere and the sentence rewrites itself for that area.
One bad summer is not loss
A hot, dry summer or a hazy pass can drag the signal down for a season. A drop only counts if it persists into the next clear summer. The cost is that the newest year is always provisional, so the interface says so plainly instead of hiding it.
Green again is not forest again
This is the decision I would most like to talk about. My first version showed the damage peaking and then shrinking from 2022. It looked like recovery.
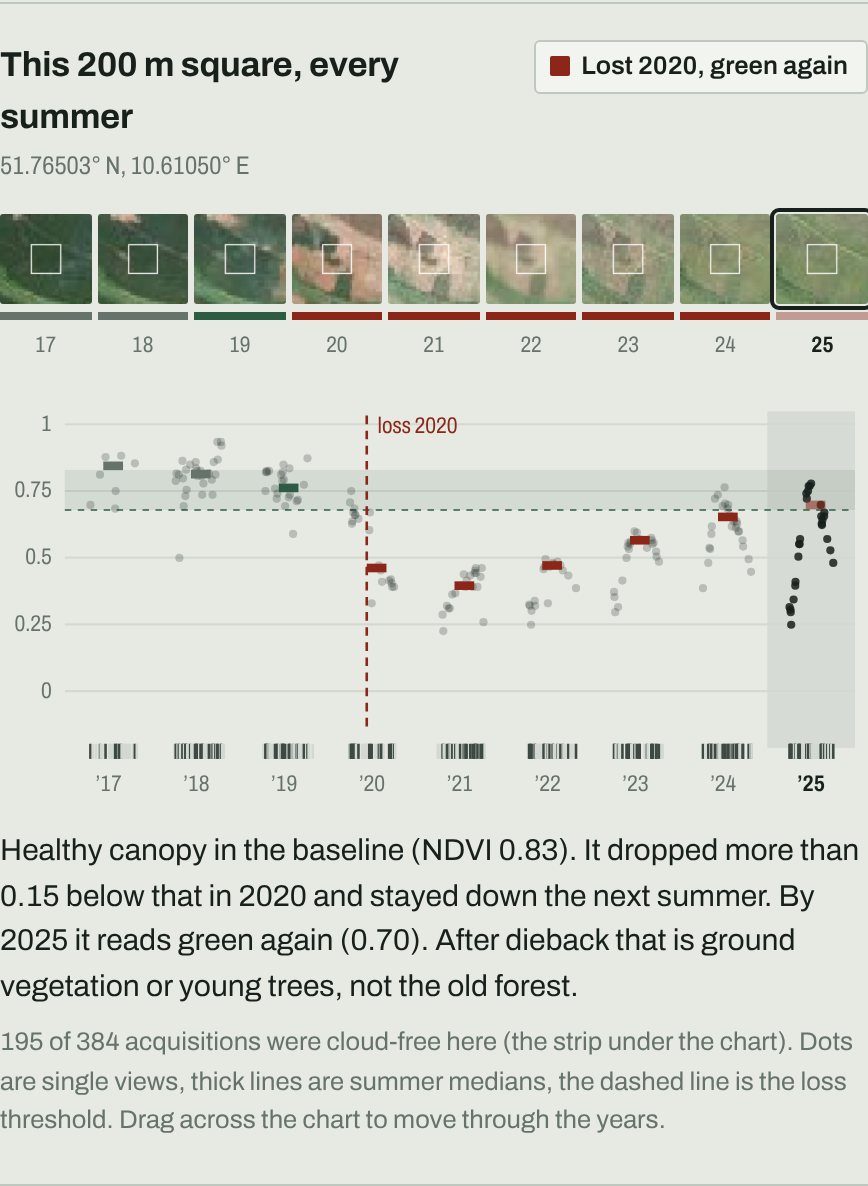
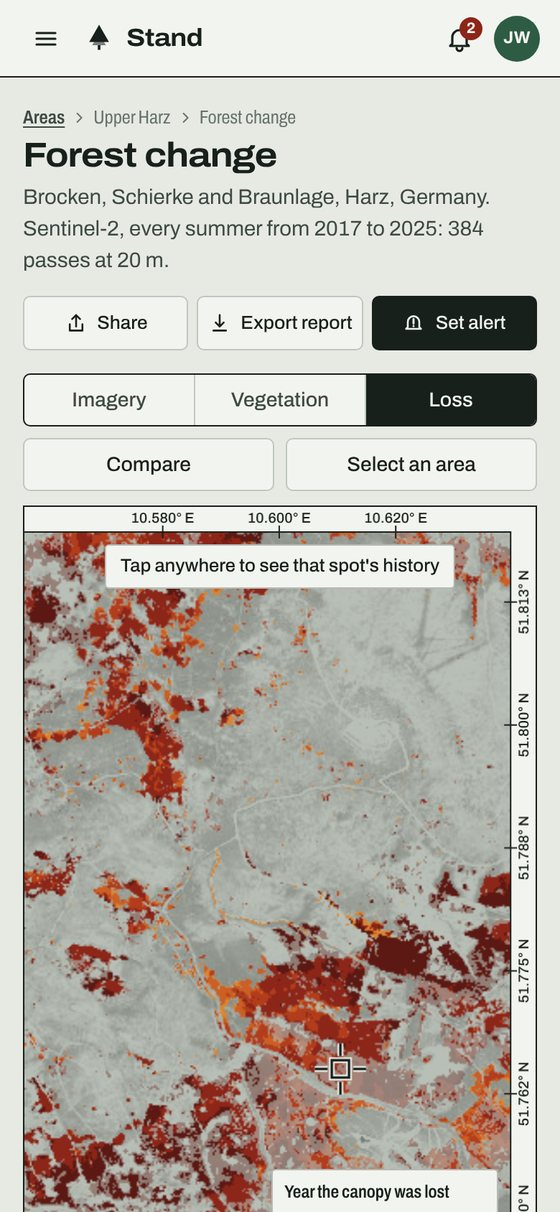
Checking individual squares told a different story. Where the spruce had died, grass, shrubs and young trees were turning the ground green again, and a vegetation index cannot tell them apart from mature canopy. A naive rule would have told a forester the problem was going away.
So regreened loss stays on the map, faded, and is reported separately: about half of the lost ground. The honest answer is less comforting and more useful.
Uncertainty is part of the answer
Cloud gaps show in three places: the line under each year on the timeline, the acquisition strip under each spot chart, and gaps in the series that are never smoothed over. Confidence comes with its reasons in plain words, such as how many cloud-free views it rests on and why this year's loss is still provisional.
Plain words, method on request
Canopy loss, cloud-free views and confidence, rather than index thresholds. The method is one tap away for anyone who wants to check the working, and the numbers are there for the people who need them.
Same product, three customers
The same question matters to very different people, so I designed the same tool for three of them, switched from a small demo control that sits outside the product. Every colour, including those drawn on the map itself, comes from one set of tokens, so each version is a stylesheet rather than a fork.
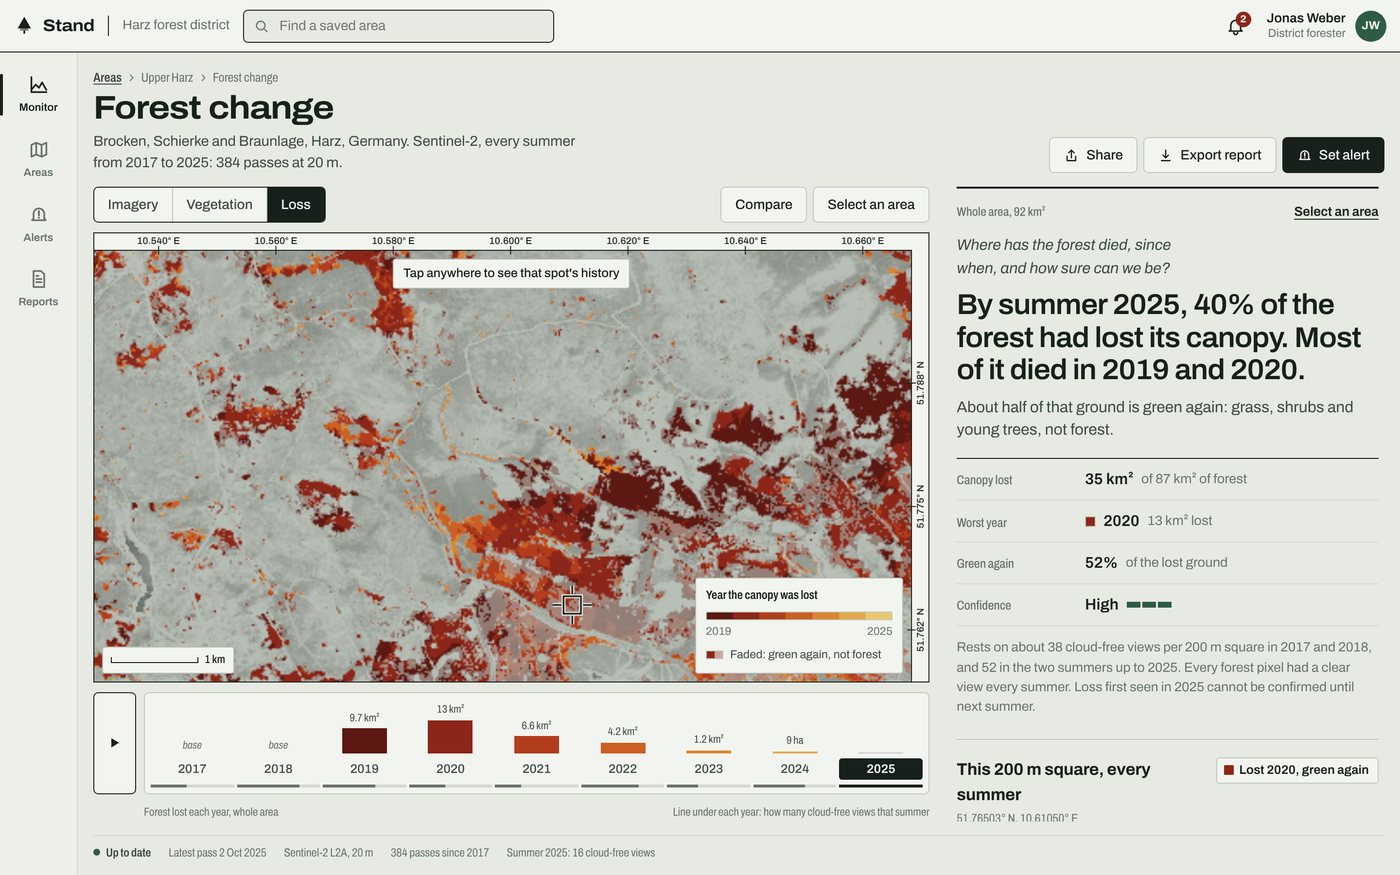
Forester: Field sheet
For a district forester on site. Paper, ink and rust, in the language of a survey map, with coordinates in the margin like a printed sheet.
Analyst: Civic
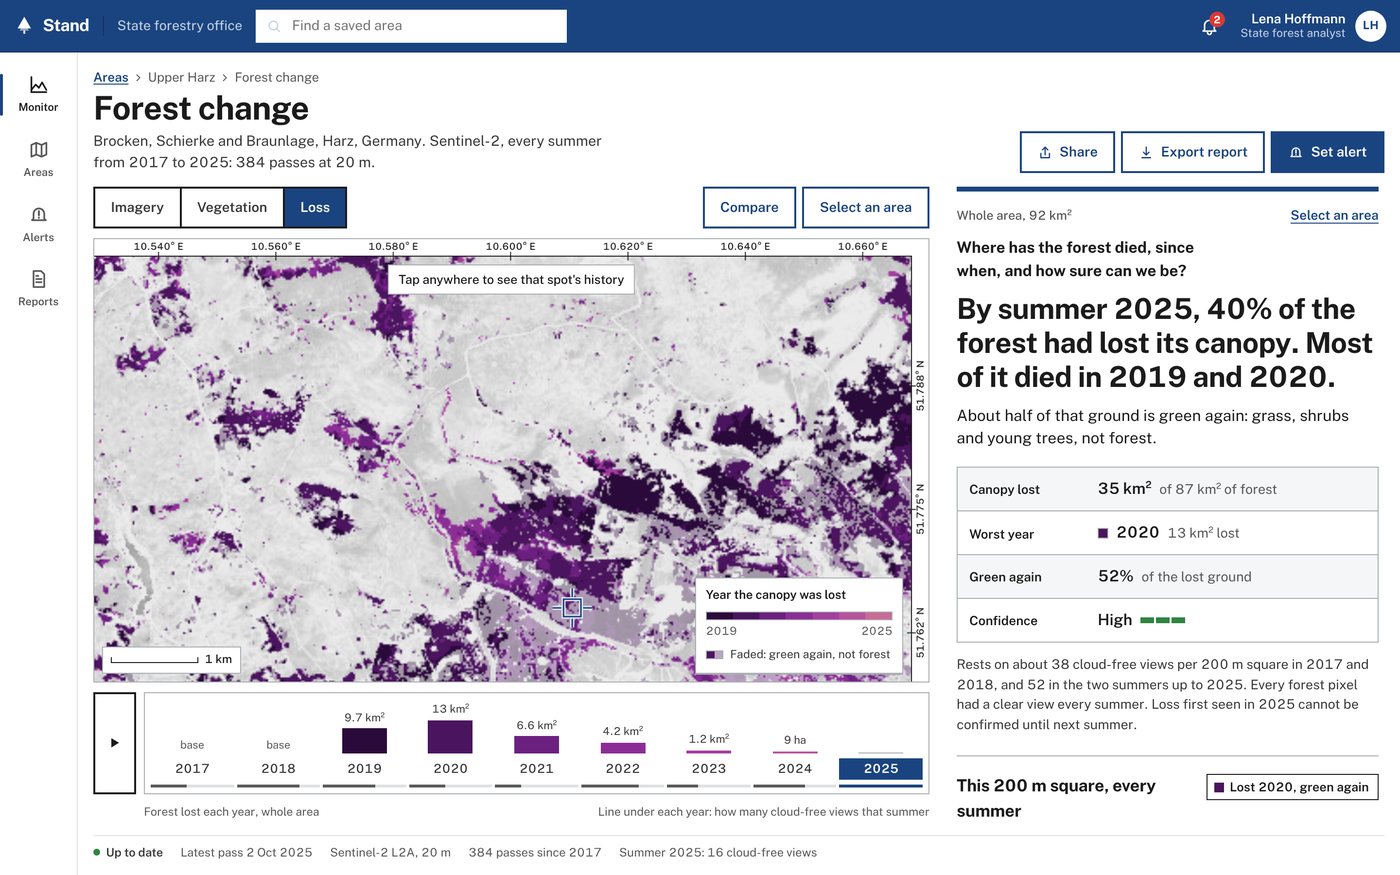
For a state analyst writing a report. High contrast, plain type, strong focus states, and loss in plum ordered by lightness, so it reads with any colour vision and is never mistaken for water.
Buyer: Orbital
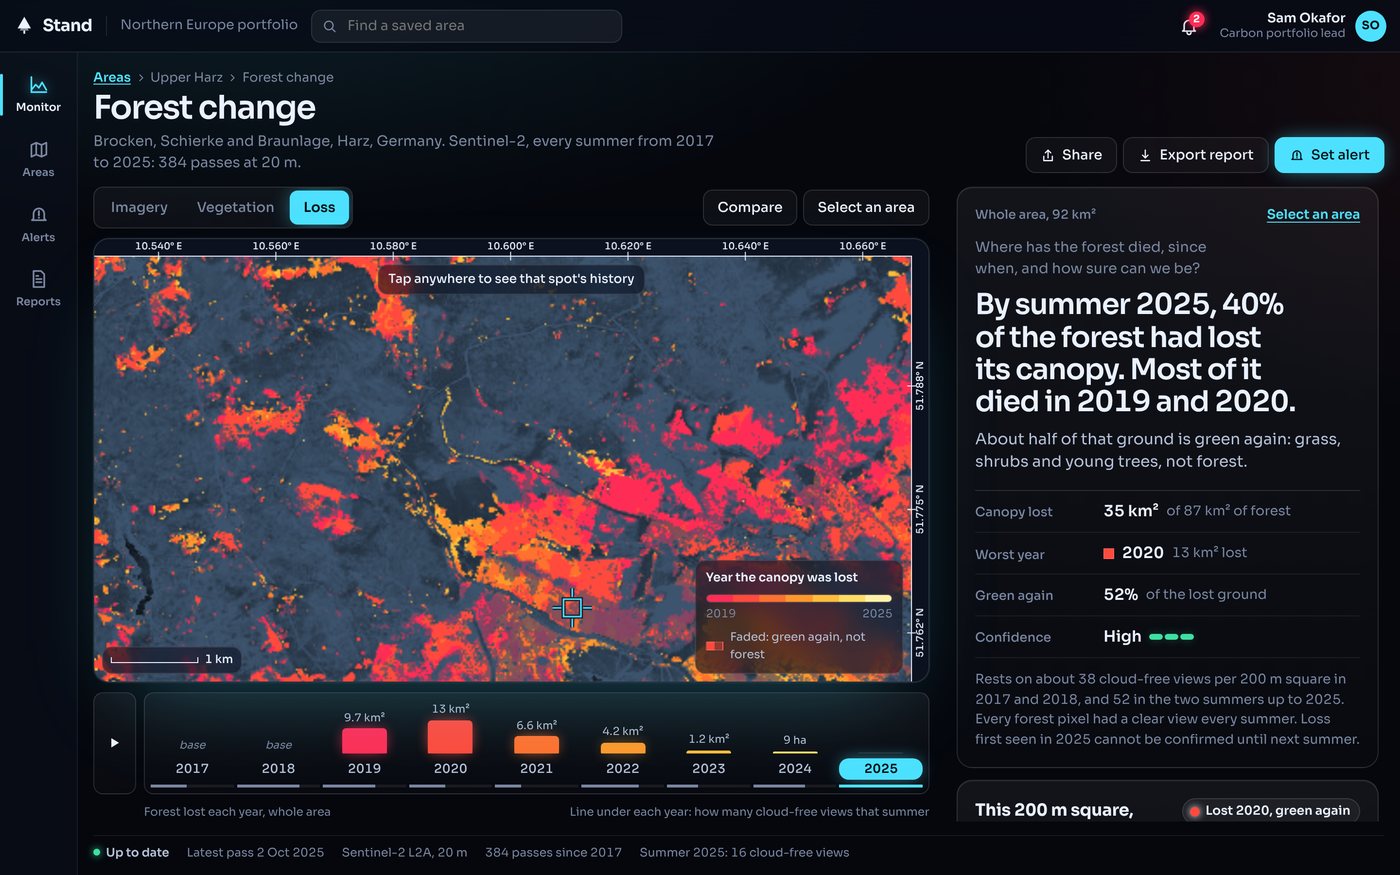
For a commercial portfolio lead. Dark and imagery-forward, with loss that glows from hot red to gold over a night-blue plate.
Where it would live
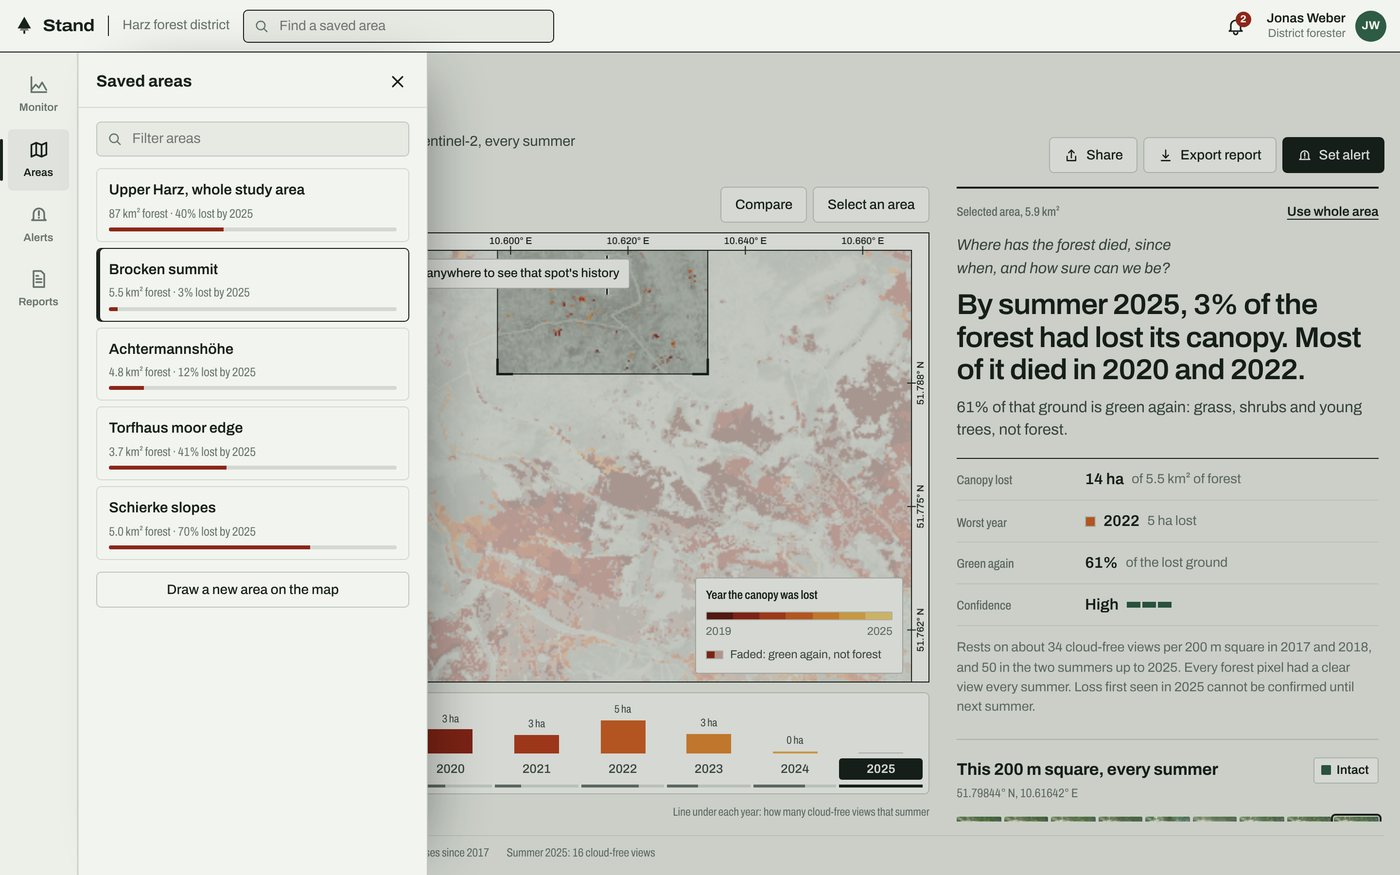
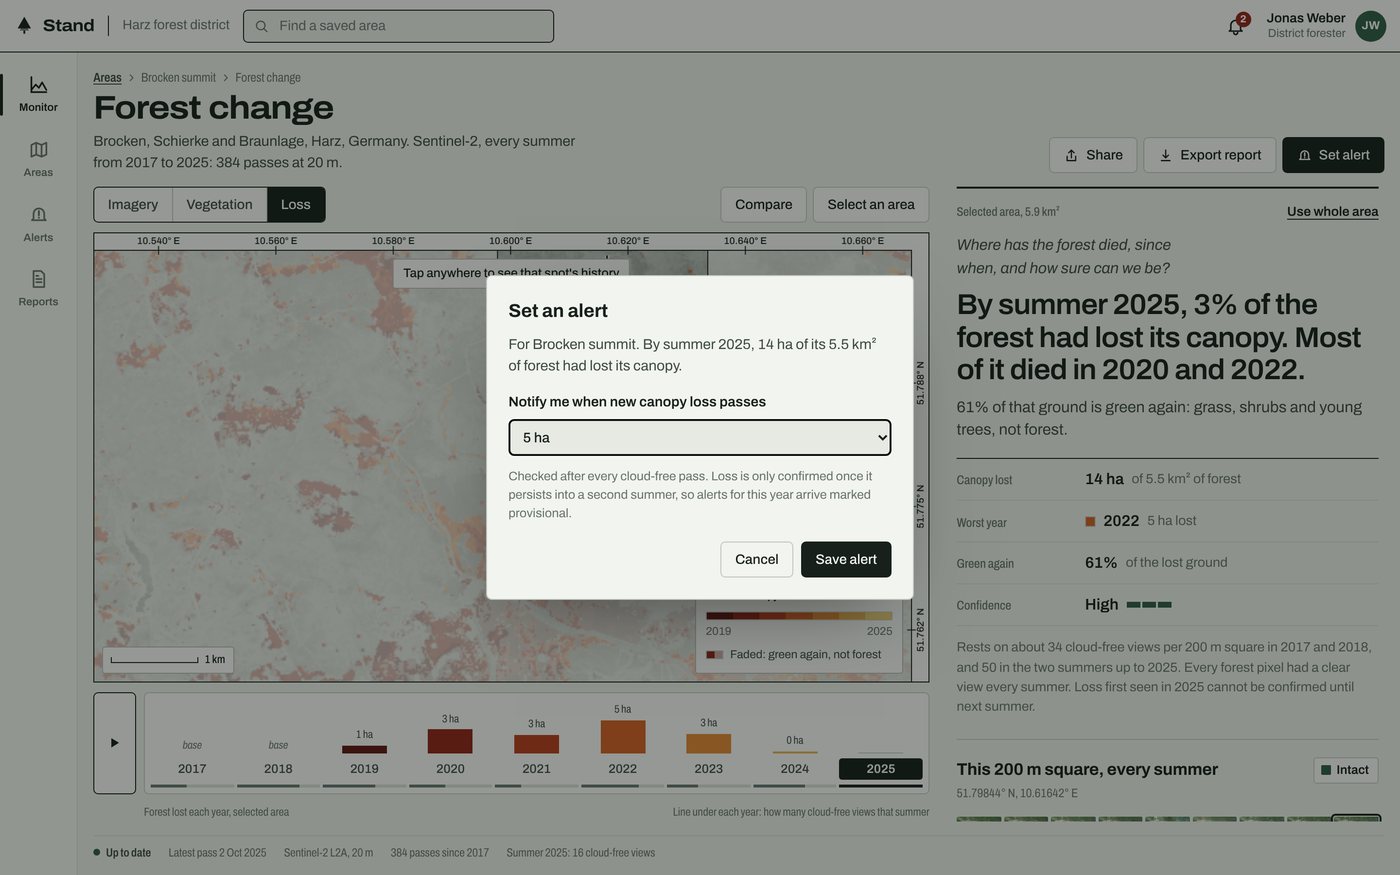
A feature is only useful once people can find their way back to it and act on what it tells them. So the explorer sits inside Stand, an invented monitoring product: saved areas you can search, alerts that respect the provisional year, a report export and a status bar that says how fresh the data is.
None of it is decoration. Opening a saved area rescopes the verdict, the timeline and the spot history. An alert is checked against the actual loss in its area after each pass. The notifications come from the real coverage, such as summer 2021 having only five cloud-free views.
On a phone
Field staff are the people most likely to open this outdoors, so every view works on a phone, and I tested it on one. The same answer, reordered: the map and timeline first, the verdict and spot history as you scroll.
What I would do next
- Separate young growth from mature canopy with a shortwave-infrared moisture index or canopy height data, turning "green again" into how much forest is actually coming back.
- Use sharper, more frequent imagery to date loss to the month rather than the summer, and to resolve individual trees that 20 m pixels miss.
- Put it in front of a forester and an analyst. The confidence wording, the alert thresholds and the provisional-year rule are my best judgement until people who make these calls have used them.
- Let people save and compare their own areas, the gap the current product admits to.
- Carry the same pattern into agentic workflows. When an agent answers a question about the Earth, it needs what this verdict has: the answer first, then its evidence and confidence attached, so a person can check it before acting on it.